Metrics Service Detailed Guide
Overview
The new Metrics Service refactors metrics reporting logic (including TensorBoard, WandB, and ClearML) into an independent service, similar to the rollout service design. The service records metrics only once at step end and supports batch reporting.
Architecture
┌─────────────────┐    HTTP/REST     ┌─────────────────┐
│    Client Code  │ ───────────────> │ Metrics Service │
│ (Training/Eval) │                  │  (Ray Serve)    │
└─────────────────┘    JSON API      └────────┬────────┘
                                               │
                                     ┌─────────┴─────────┐
                                     │  Metrics Buffer   │
                                     └─────────┬─────────┘
                                               │
                                ┌──────────────┼──────────────┐
                                ▼              ▼              ▼
                         ┌──────────┐   ┌──────────┐   ┌──────────┐
                         │ Tensor-  │   │   WandB  │   │ ClearML  │
                         │  Board   │   │          │   │          │
                         └──────────┘   └──────────┘   └──────────┘
Code Structure
relax/utils/metrics/
├── __init__.py          # Package entry, exports MetricsClient, get_metrics_client
├── service.py           # MetricsService (Ray Serve deployment) + MetricsBuffer
└── client.py            # MetricsClient (HTTP client) + get_metrics_client

relax/utils/metrics/
├── metrics_service_adapter.py  # MetricsServiceAdapter (backward compatibility adapter)

relax/utils/
└── tracking_utils.py           # Integration entry (init_tracking, log, flush_metrics)
Key Features
- Independent Service: Deployed with Ray Serve, decoupled from main application
- Batch Reporting: Records only once at step end, reducing network overhead
- Backward Compatible: Maintains the same interface as existing
tracking_utils.log() - Multi-Backend Support: Simultaneously supports TensorBoard, WandB, and ClearML
- Asynchronous Processing: Metrics collection and reporting are separated
Configuration Options
Required Configuration
python
args.use_metrics_service = True  # Enable metrics service
# Service URL is automatically obtained via get_serve_url(), no manual configuration needed
Backend Configuration (Same as Before)
python
# TensorBoard
args.use_tensorboard = True
args.tb_project_name = "my-project"
args.tb_experiment_name = "experiment-1"

# WandB
args.use_wandb = True
args.wandb_project = "my-project"
args.wandb_team = "my-team"
args.wandb_group = "my-group"

# ClearML
args.use_clearml = True
# ClearML automatically reads configuration from environment variables
Migration Guide
Migrating from Old System
Painless Migration: If you want to keep existing code unchanged, simply:
- Add
use_metrics_service=Trueto configuration - Add
tracking_utils.flush_metrics(args, step)at appropriate places (e.g., step end)
- Add
Gradual Migration: You can run both old and new systems simultaneously, controlled by configuration:
- Set
use_metrics_service=Falseto use old system - Set
use_metrics_service=Trueto use new system
- Set
Code Comparison
Before:
python
# Call directly each time you need to log
tracking_utils.log(args, metrics, "step")
After (Batch Mode):
python
# In training loop
for step in range(total_steps):
    # ... training code ...

    # Log metrics (buffered, not sent immediately)
    metrics = {
        "step": step,
        "train/loss": loss,
        "train/accuracy": accuracy,
    }
    tracking_utils.log(args, metrics, "step")

    # Report all buffered metrics at step end
    tracking_utils.flush_metrics(args, step)
API Reference
Metrics Service HTTP API
POST /metrics/log_metric- Log single metricPOST /metrics/log_metrics_batch- Log metrics in batchPOST /metrics/report_step- Report all metrics for specified stepGET /metrics/health- Health checkGET /metrics/query_metrics- Get recorded metricsPOST /metrics/clear_metrics- Clear metrics
Python Client API
python
class MetricsClient:
    def __init__(self, service_url: str = "http://localhost:8000/metrics")
    def log_metric(step, metric_name, metric_value, tags=None, immediate=False)
    def log_metrics_batch(step, metrics, tags=None, immediate=False)
    def report_step(step)
    def health_check()
    def clear_buffer(step=None)
    def get_buffered_metrics_count(step=None)
Backward Compatible Adapter
python
class MetricsServiceAdapter:
    def __init__(args)  # Service URL automatically obtained via get_serve_url()
    def log(metrics, step_key="step")  # Same interface as tracking_utils.log
    def flush()
    def direct_log(step, metrics)
Performance Considerations
- Network Latency: Metrics Service is an independent service with network round-trip overhead
- Batch Advantages: Report only once at step end, reducing total requests
- Buffering Mechanism: Client-side buffering of metrics, reducing network calls
- Asynchronous Processing: Service internally processes reporting asynchronously, non-blocking to client
Troubleshooting
Common Issues
- Service Unreachable: Check if Ray Serve is properly deployed and network connectivity
- Metrics Not Reported: Ensure
flush_metrics()orreport_step()is called - Backend Configuration Error: Check TensorBoard/WandB/ClearML configuration
Debug Mode
python
# Enable verbose logging
import logging
logging.basicConfig(level=logging.DEBUG)

# Check service health
from relax.utils.metrics.client import MetricsClient
from relax.utils.utils import get_serve_url

service_url = get_serve_url(route_prefix="/metrics")
client = MetricsClient(service_url)
health = client.health_check()
print(f"Service health: {health}")
Examples
For complete examples, refer to relax/entrypoints/deploy_metrics_service.py.
Run the example:
bash
python relax/entrypoints/deploy_metrics_service.pyTimelineTrace
TimelineTrace records and visualizes timeline events during training, supporting Chrome Trace Event Format, viewable in Chrome browser's chrome://tracing.
Configuration
bash
--timeline-dump-dir ./timeline_traces # Empty means disabled, directory path means enabledUsage Example
python
import time
from relax.utils.metrics.client import MetricsClient

client = MetricsClient()

# Record event start
event_begin = {
    "name": "forward_pass",
    "ph": "B",
    "ts": int(time.time() * 1e6),
    "pid": 0,
    "tid": 0,
    "args": {"step": 100}
}
client.log_metric(step=100, metric_name="timeline", metric_value=[event_begin])

# Perform operation
perform_forward_pass()

# Record event end
event_end = {
    "name": "forward_pass",
    "ph": "E",
    "ts": int(time.time() * 1e6),
    "pid": 0,
    "tid": 0,
    "args": {"step": 100}
}
client.log_metric(step=100, metric_name="timeline", metric_value=[event_end])

# Report step, automatically export timeline
client.report_step(step=100)
# Generated file: ./timeline_traces/timeline_step_100.json
Visualization
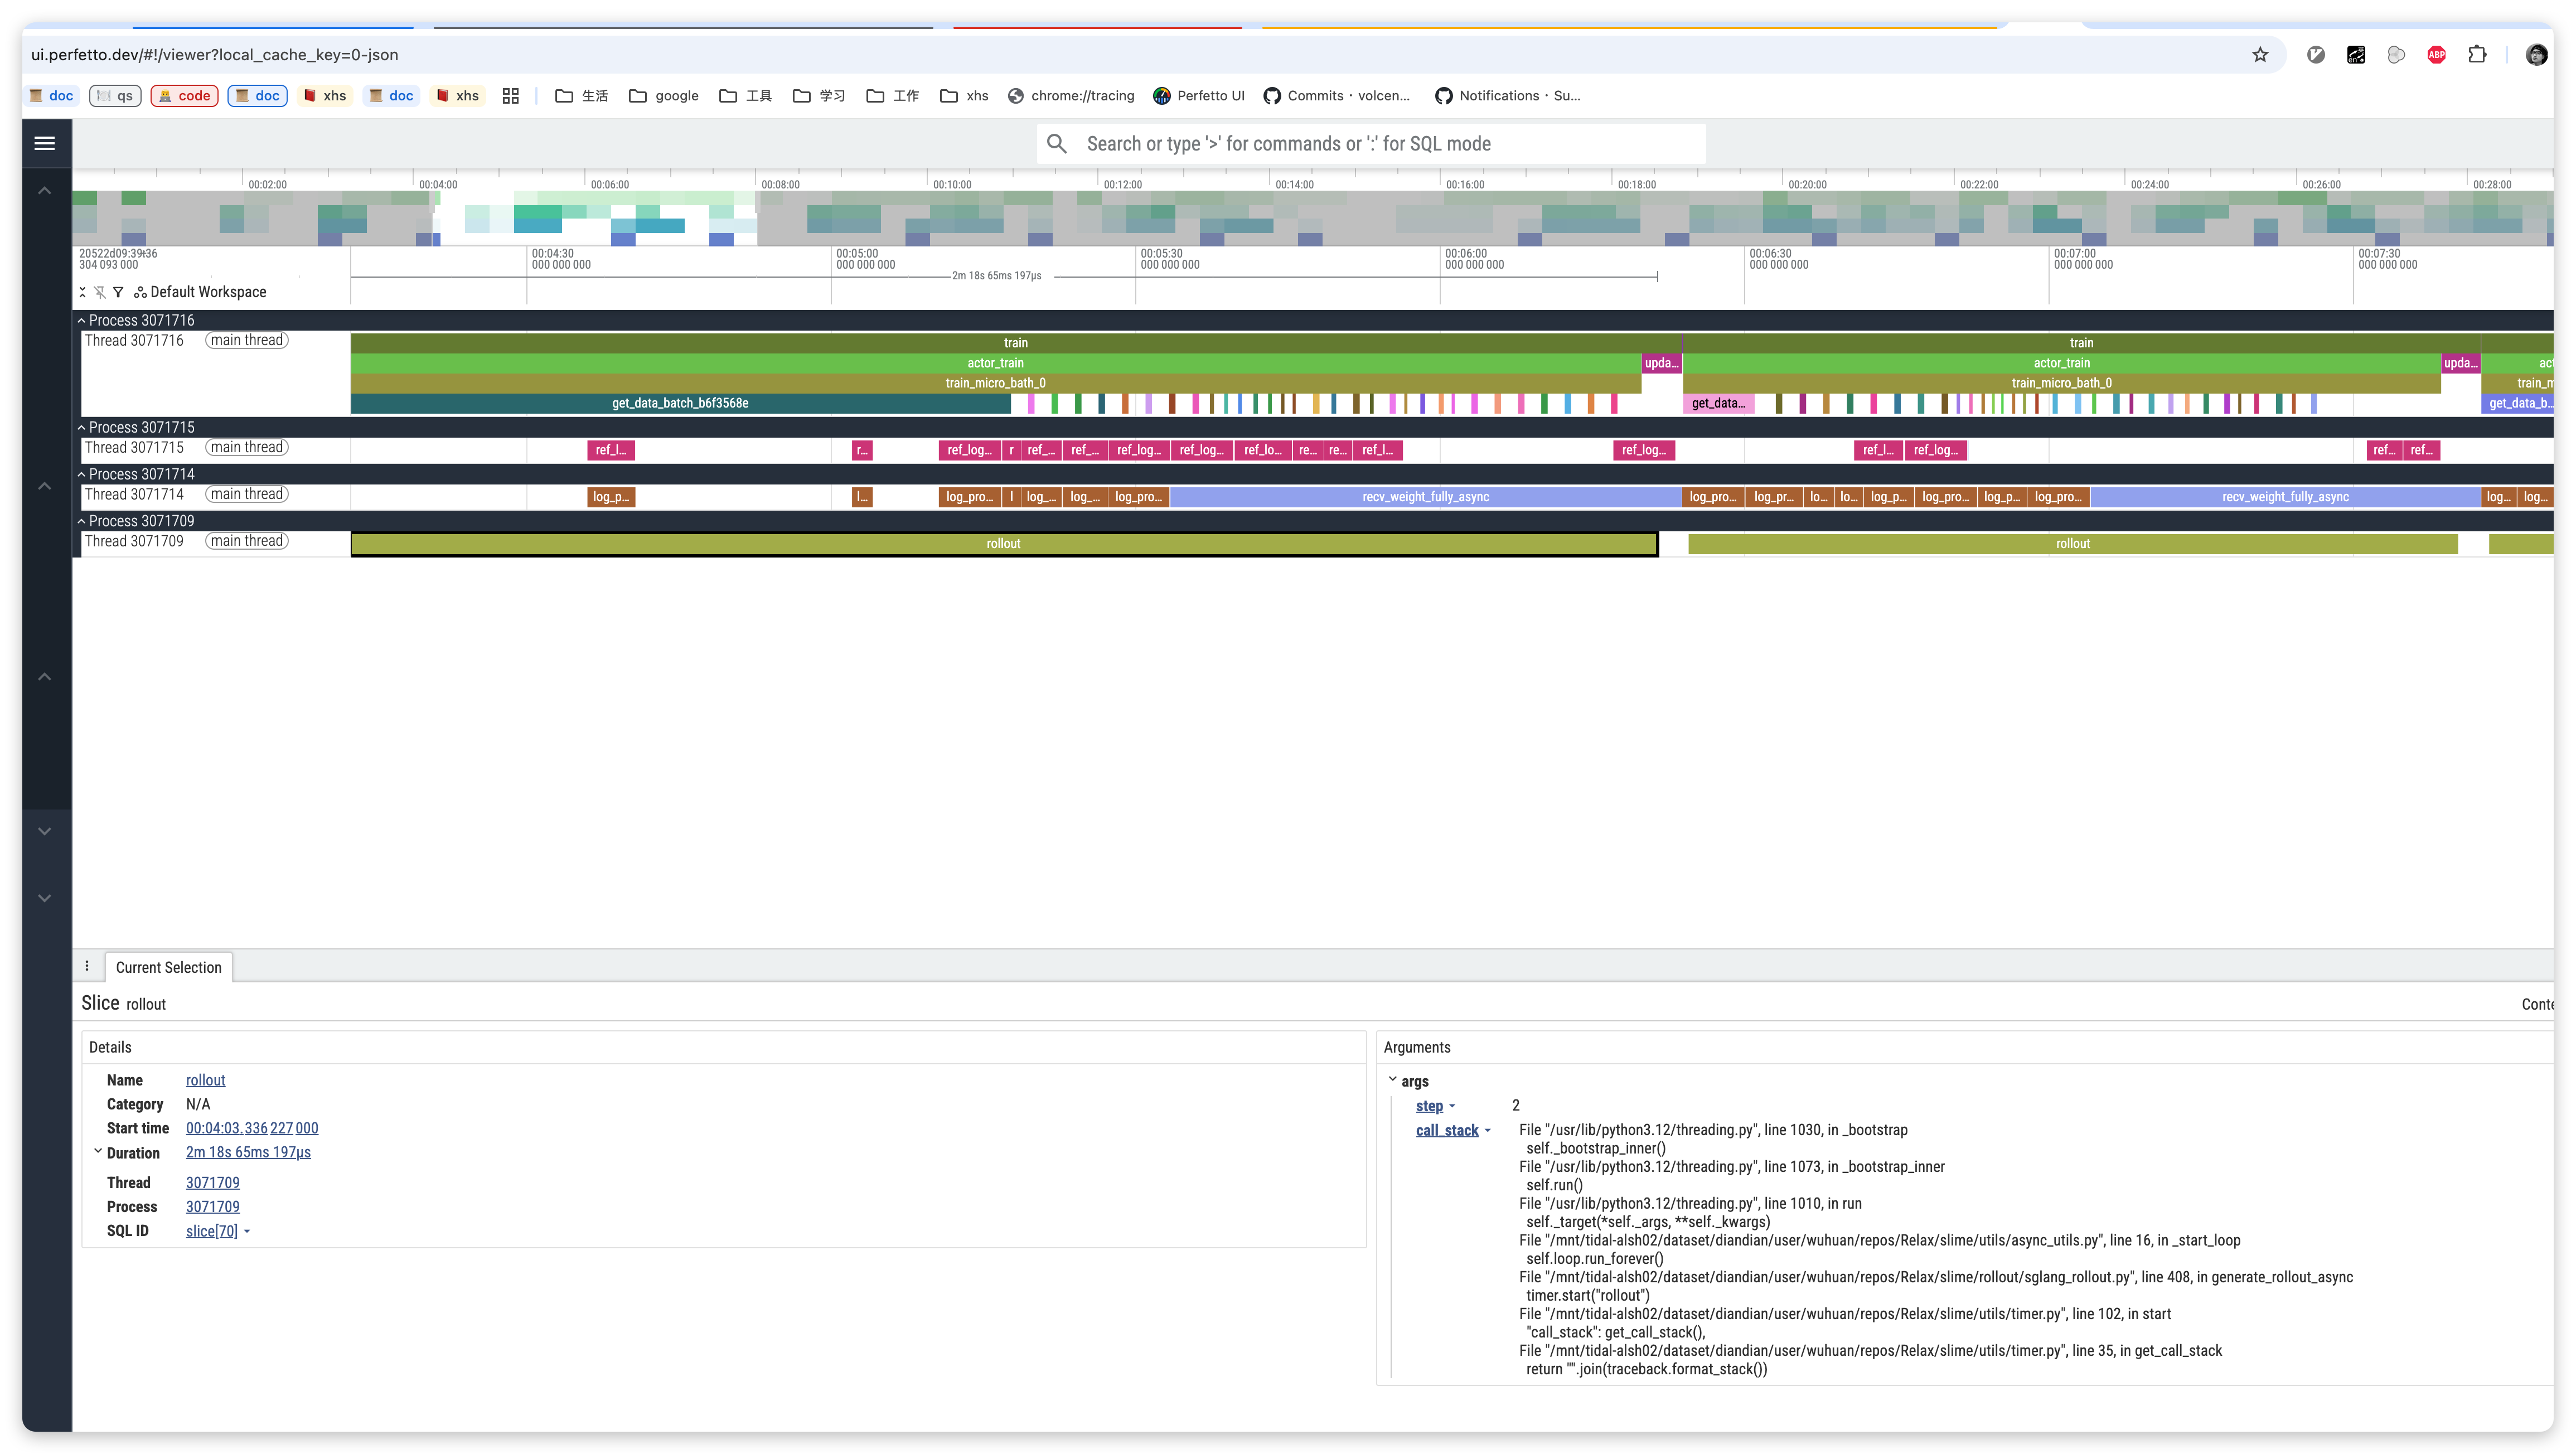
- Open Chrome browser
- Visit
chrome://tracing - Click "Load" button
- Select the generated JSON file
Summary
The new Metrics Service provides:
- Better Architecture: Service-oriented design, decoupled from main application
- Performance Optimization: Batch reporting, reducing network overhead
- Easy Maintenance: Centralized management of all metrics reporting logic
- Backward Compatible: Existing code can migrate without modification
- Extensibility: Easy to add new metrics backends